In this post I’m going to share the top 10 Google Analytics Custom Reports that I use for analyzing SEO data.
Whether you’re new to Google Analytics or an old hand, Custom Reports couldn’t be easier. Simply click on the links provided and they will open Google Analytics, simply select the profile you want to use them on, and you’ll be taken straight to the report.
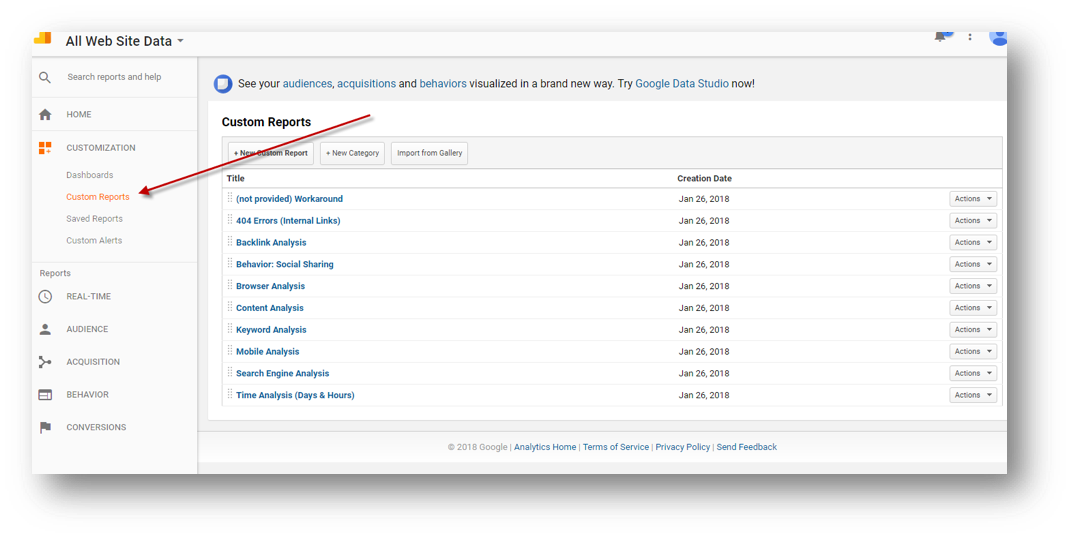
To find the reports once you have added them, simply navigate to ‘Customization’ and then to ‘Custom Reports’.
You can customise any of these reports by clicking the edit button:
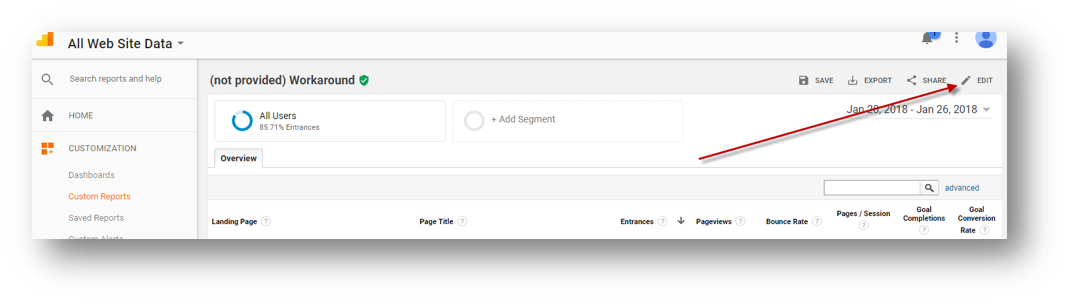
From here you can add, change or remove metrics like ‘Sessions’ or ‘Goal Completions’, as well as adding, changing or removing dimensions and filters. Typically changing a filter will fundamentally change what the report shows you, but be warned; the filter is applied to all tabs. If you remove a filter from one tab, it is removed from all tabs of the report.
1. Time Analysis (Days and Hours)
This Custom Report comes with four tabs that allow you to analyze and interrogate your SEO traffic data by the various segments of time.
Hour of Day
The first tab shows you the SEO traffic by the hour of the day, shown as a 24-hour clock:
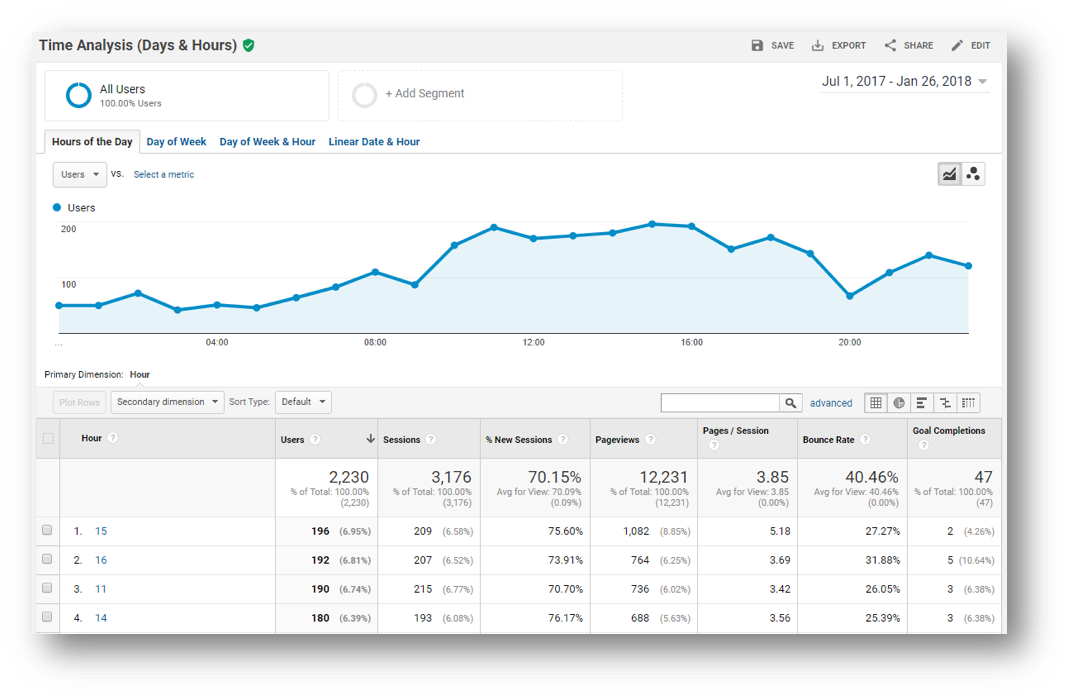
This is great for finding out when in the day users are most likely to convert, make a purchase or engage with your site. You can also see when site usage is at its highest and lowest, you can use this type of data to inform a range of decisions and strategies. If you are planning to update the site, you will want to when people are less likely to use the site.
Day of Week
The next tab shows the SEO traffic by the day of week:
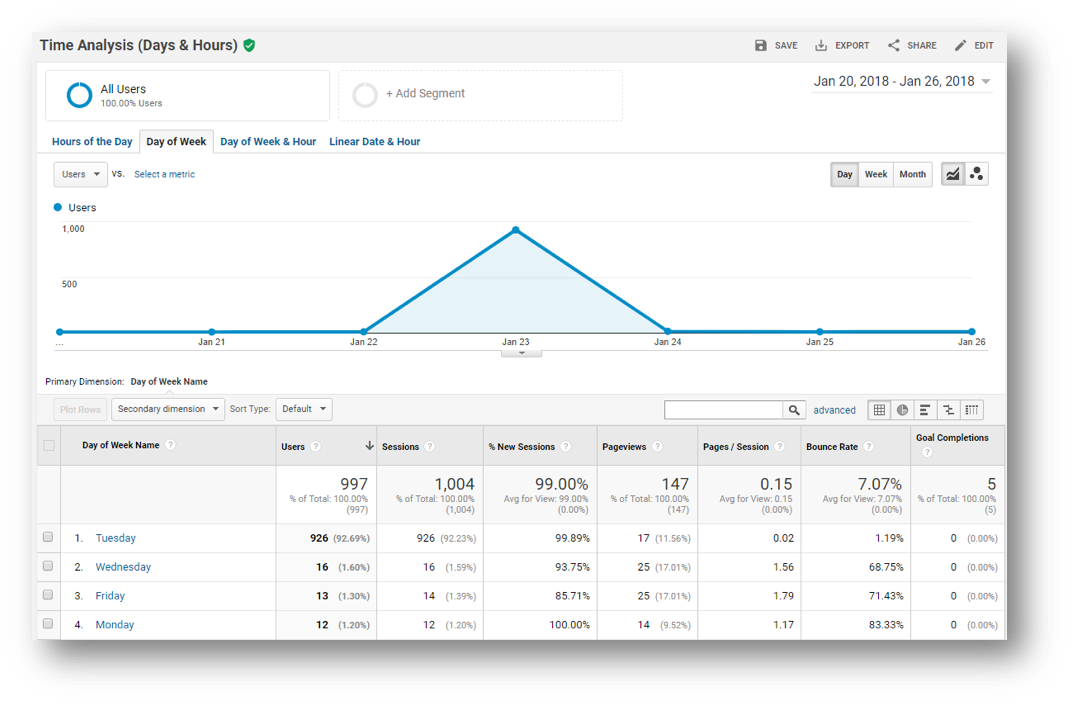
Select your date range and you will see the metrics above aggregated into the days of the week. This can inform decisions about when to promote your content or services; when to run promotions, or when to share content with your audience for example.
Click the link to get the Google Analytics Custom Report for Time Analysis (Days & Hours).
2. Backlink Analysis
This simple report shows you the referral traffic, which by definition, has to have come from your site’s backlink profile.
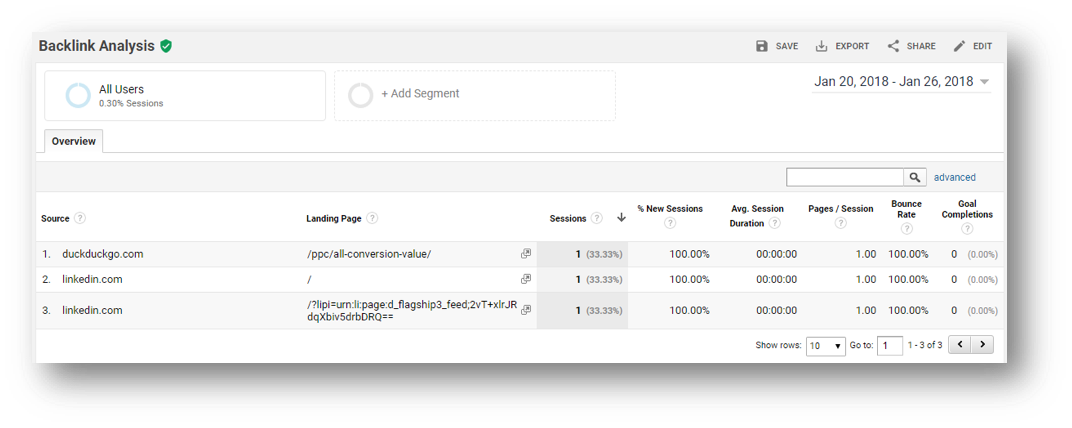
You can use this data to see what new links you are acquiring as well as the quality and value of the traffic they are delivering to your site. Bear in mind that you will only see data for links that have been clicked by a user.
Change the following variable to your site’s domain name (as indicated below) to ensure you exclude traffic from your own site or entities. If you have other sites, you can exclude them from here:
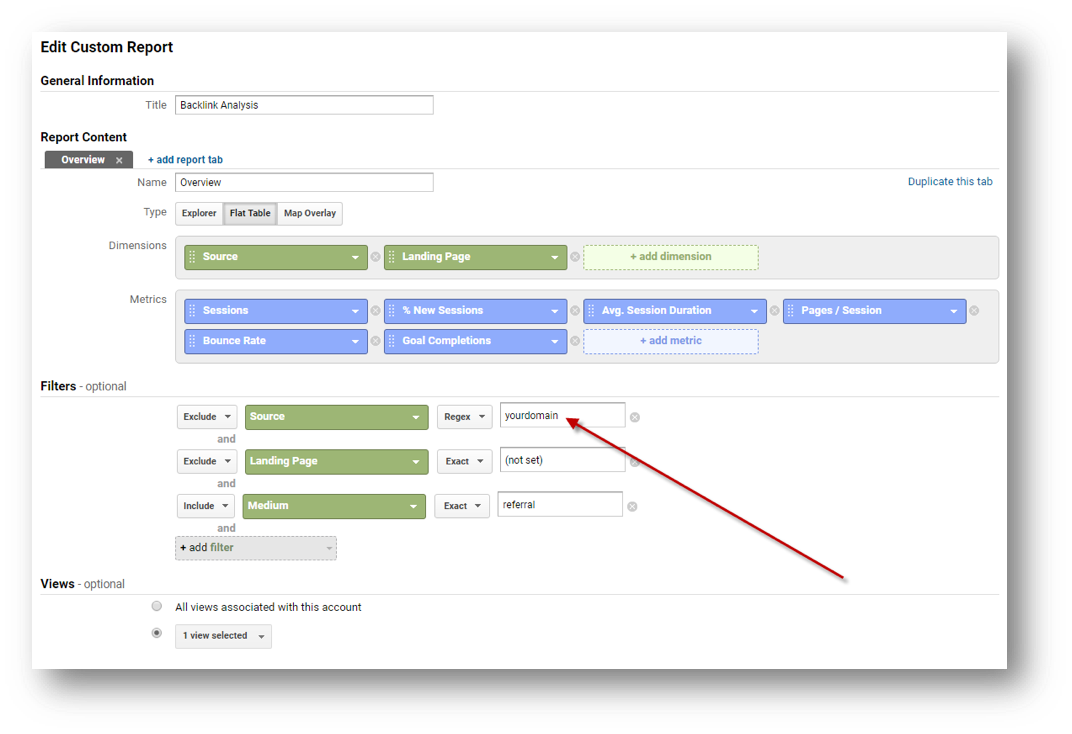
The above screenshot also shows you where you can change the metrics, which are in the blue boxes. Every site is different, so I have made these generic enough to be useful to most sites. You can change these or duplicate the tab and create your own custom reports specific to your needs. If you need to track revenue or transactions, or specific goals (rather than all goal completions), you can do that from here.
The same is true for all reports shown in this guide.
Click the link to get the Google Analytics Custom Report for Backlink Analysis.
3. Browser Analysis
It’s always good to know how people are accessing your site, this custom report reveals the browser that users are accessing your site through.
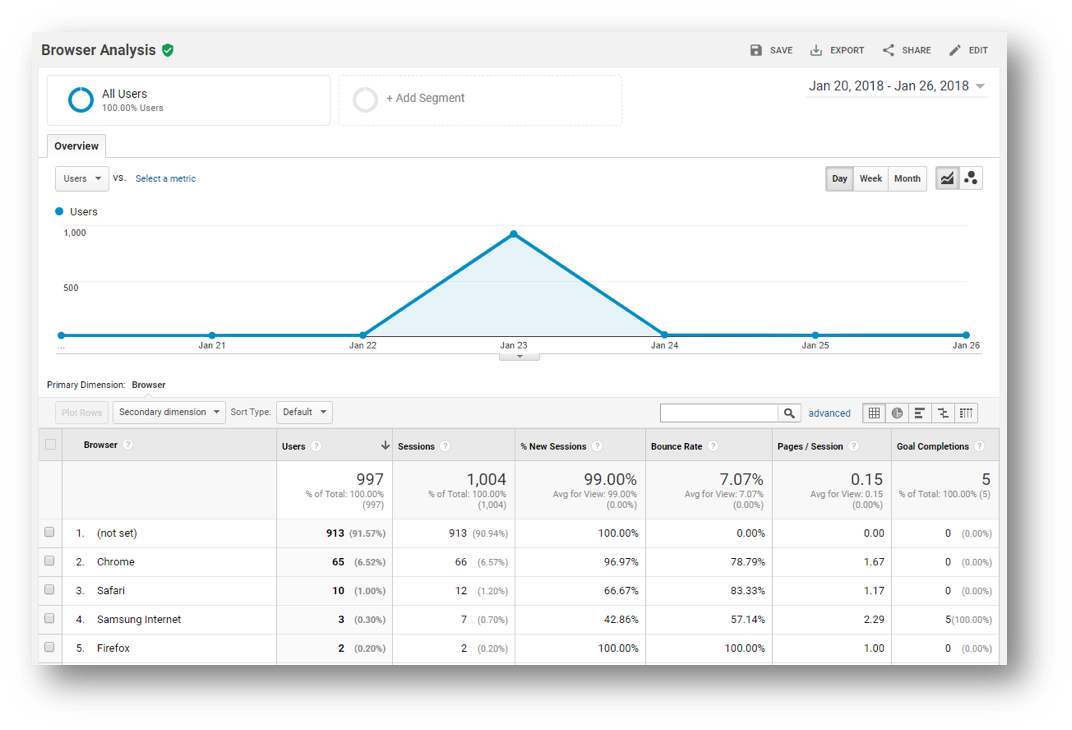
It’s worth loading your site in these browsers and checking important pages to ensure that they render properly. A site that doesn’t render in a browser used by a lot of visitors is going to equate to a lot of lost business as a result.
You can change metrics (see image below) to customize the report to your specific needs:
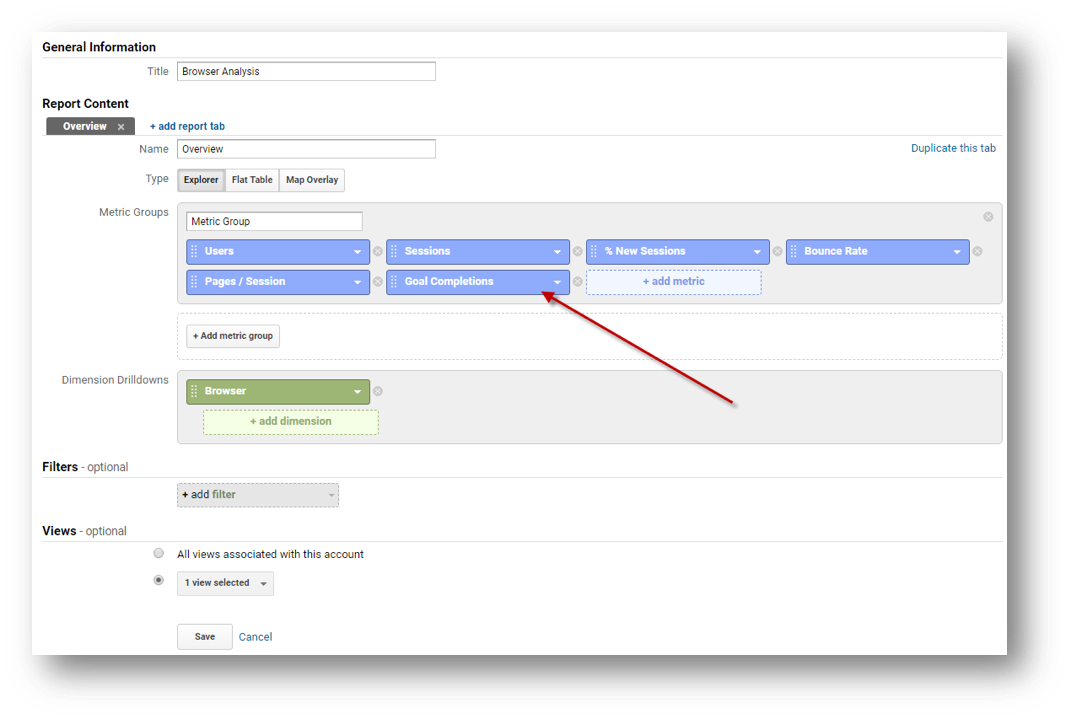
Click the link to get the Google Analytics Custom Report for Browser Analysis.
4. Mobile Analysis
A huge amount of people use mobile phones to access sites and consume content, use this handy report to see how mobile traffic performs. This report has four tabs to help you understand how mobile users perform and behave on your site.
Mobile OS (Operating System)
The first tab looks at the operating systems of mobile users:
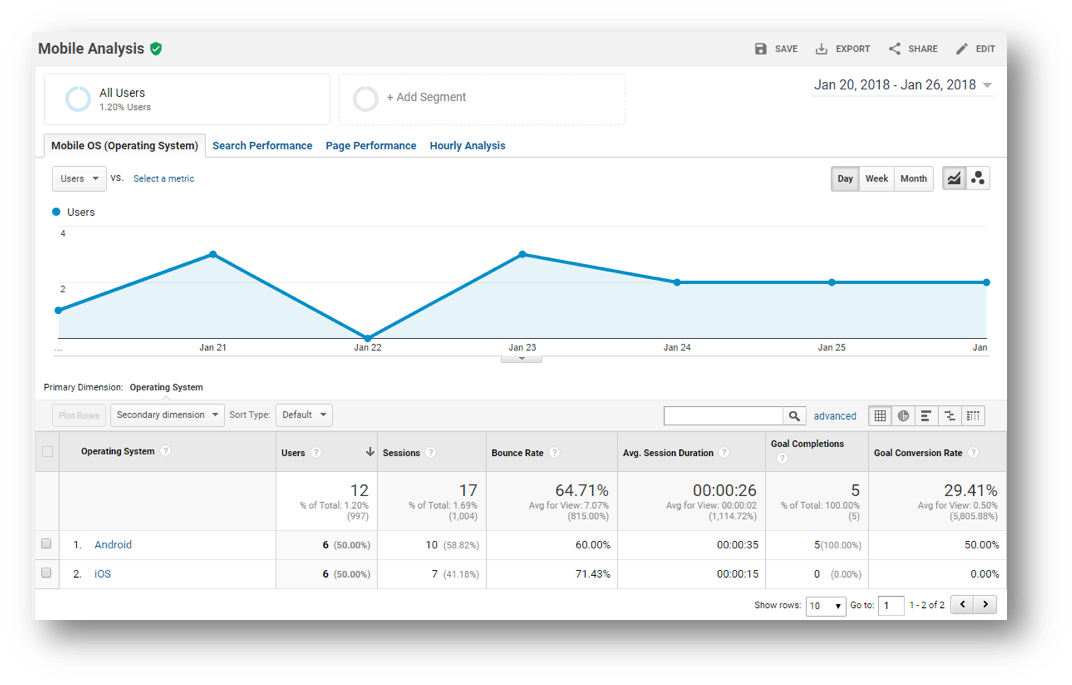
You can use this information to inform you of what devices and OS’s you need to ensure your site works perfectly on.
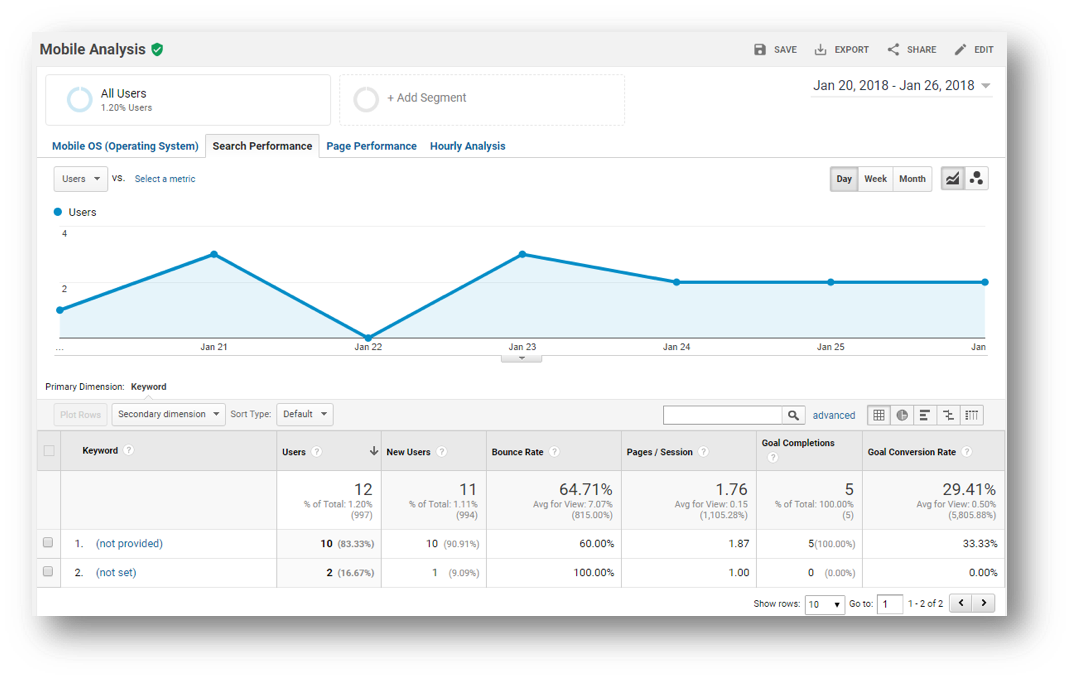
Search Performance on Mobile
The second tab shows organic search performance at a keyword level by mobile users:
Page Performance on Mobile
The third tab shows the page level performance of mobile users:
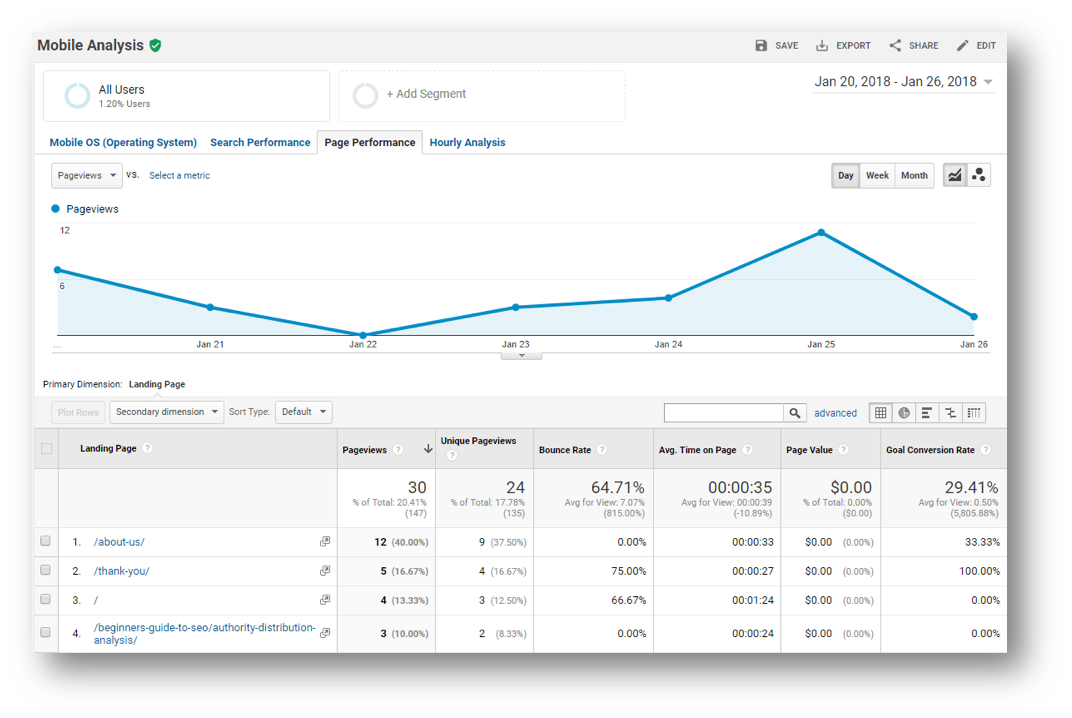
Here you can see the performance of specific pages on mobile devices, this can help you to identify problem pages or successful pages. The learning of which should inform your decisions about what to change or how to improve your site for the needs of the mobile audience.
If you have a mobile site, you can also use this report to see whether mobile users are using the mobile version of the site.
Hour of The Day
In the fourth tab we segment mobile users by the hour of the day:
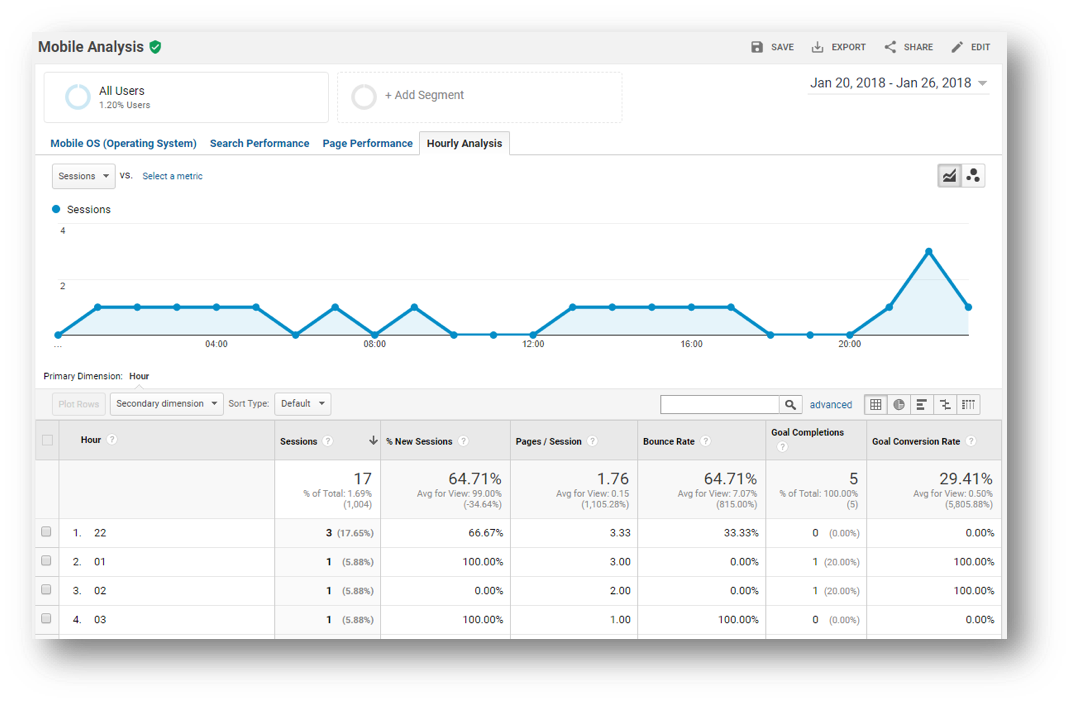
This provides some insight into the behavior of mobile users vs desktop; you can compare the results of these two devices to identify patterns in behavior.
Click the link to get the Google Analytics Custom Report for Mobile Analysis.
5. Search Engine Analysis
This is another simple report that will be more useful in regions where Search Engines other than Google have a significant market share. In any case, you can see how well each source of traffic performs in contrast to the others:
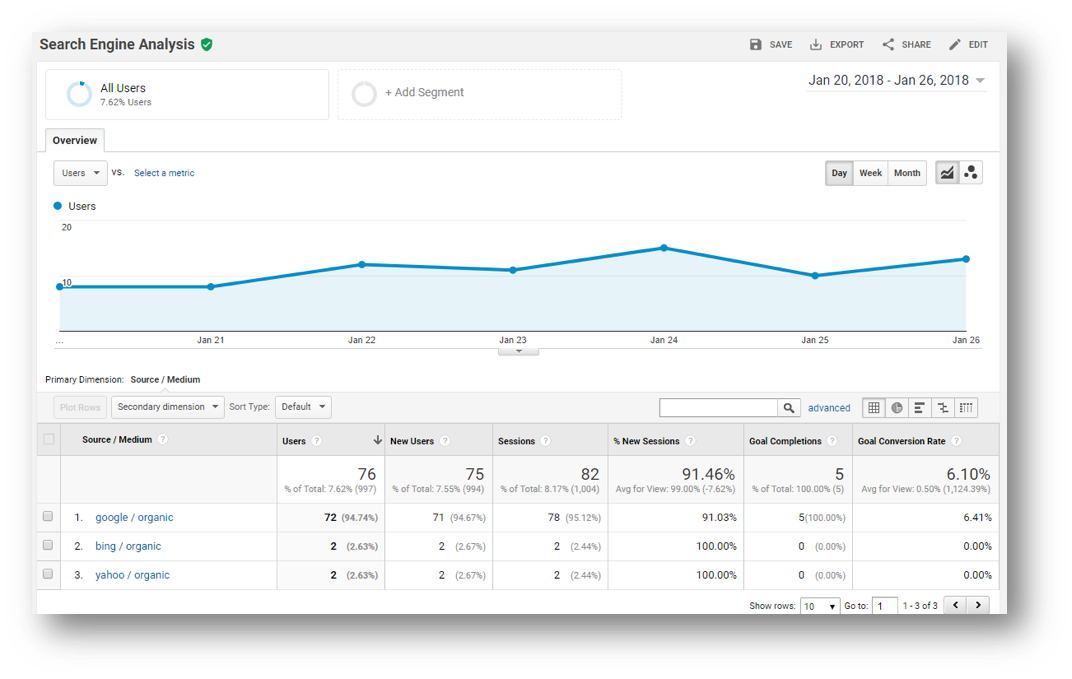
Click the link to get the Google Analytics Custom Report for Search Engine Analysis.
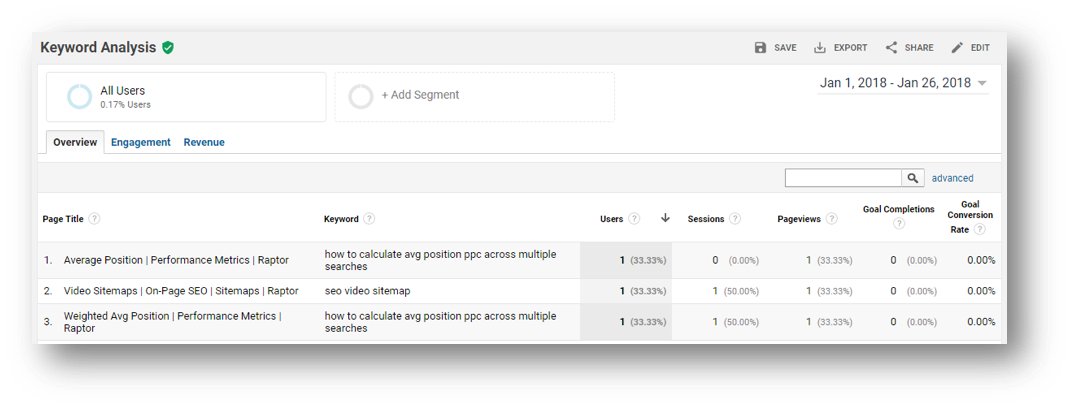
6. Keyword Analysis
This report has three tabs that pull in organic keyword data, however, this is something of a relic nowadays as much of the keyword data is obscured from us. That said, if you do have significant volumes of traffic, you will see some keyword data:
Overview
The first tab is a top-level overview of the keyword data:
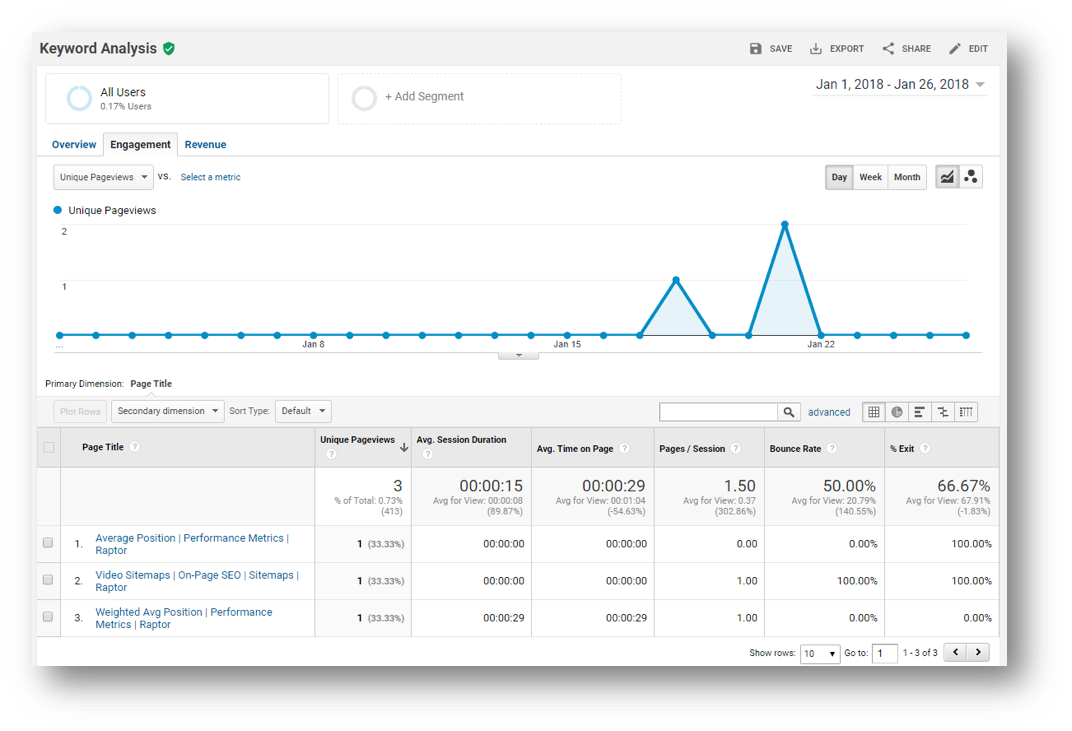
Engagement
The second tab looks at the engagement metrics of the traffic by keyword:
Revenue
The second tab looks at the revenue metrics of the traffic by keyword (you will need to have this setup in Google Analytics to see this data):
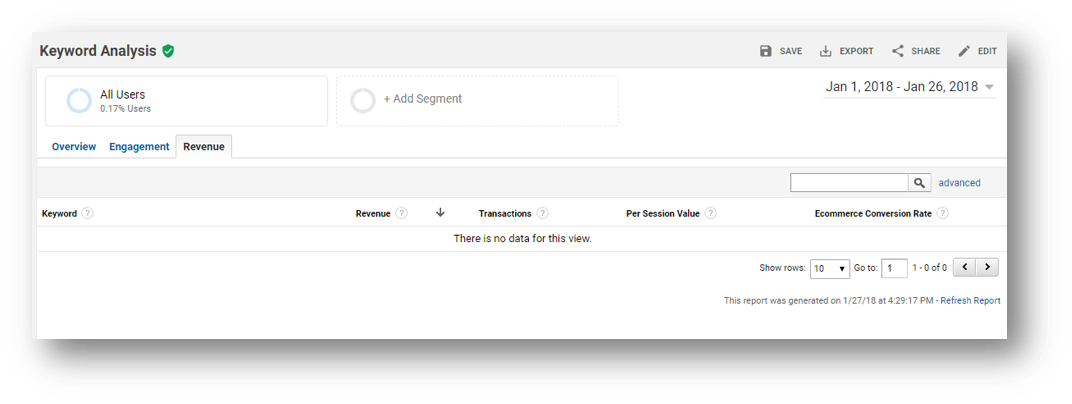
Click the link to get the Google Analytics Custom Report for Keyword Analysis.
7. Not Provided Workaround
This is a simple shareable workaround to the problem of ‘not provided’ data. As mentioned, Google obfuscates a lot of keyword data now, this report can help to unravel some the ‘not provided’ data. You will need to optimize page titles to make this report useful:
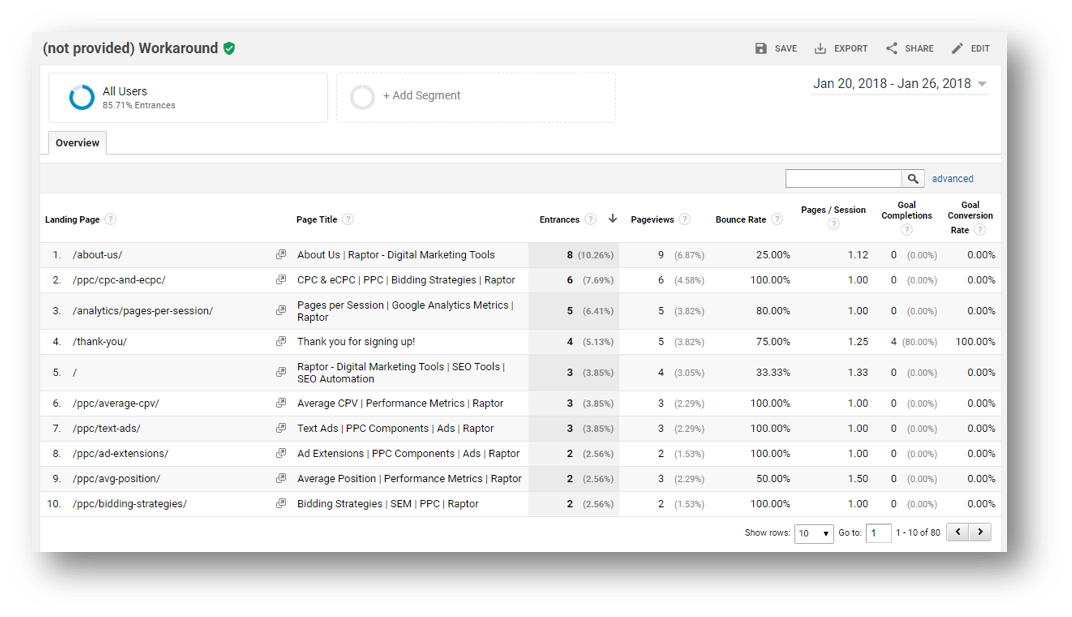
Click the link to get the Google Analytics Custom Report for Not Provided Workaround.
8. Geographical Analysis
This easy to use report provides shows you a suite of metrics to analyze your SEO traffic by the country that it came from, use this to see where your biggest markets are!
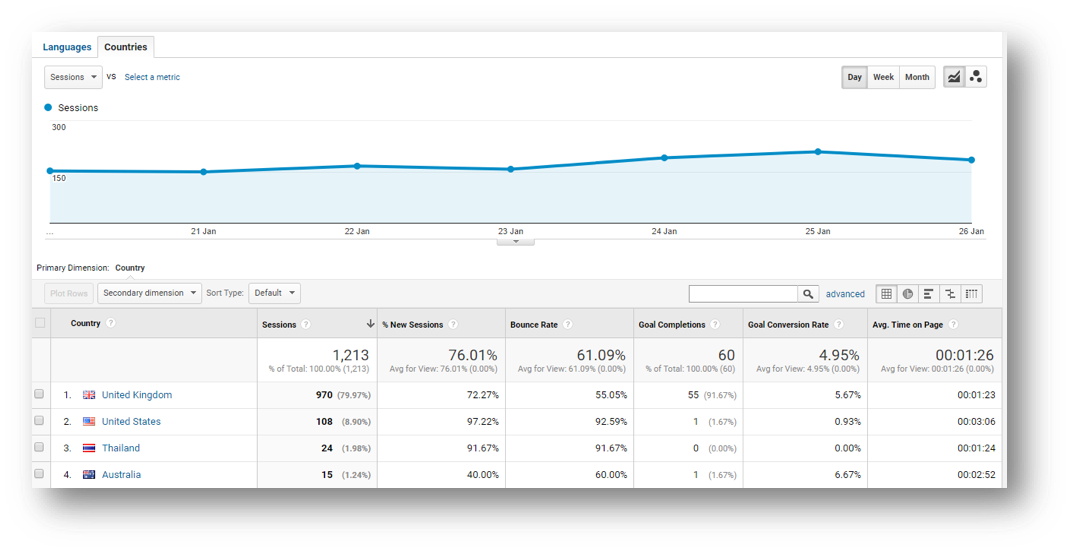
Click the link to get the Google Analytics Custom Report for Geographical Analysis.
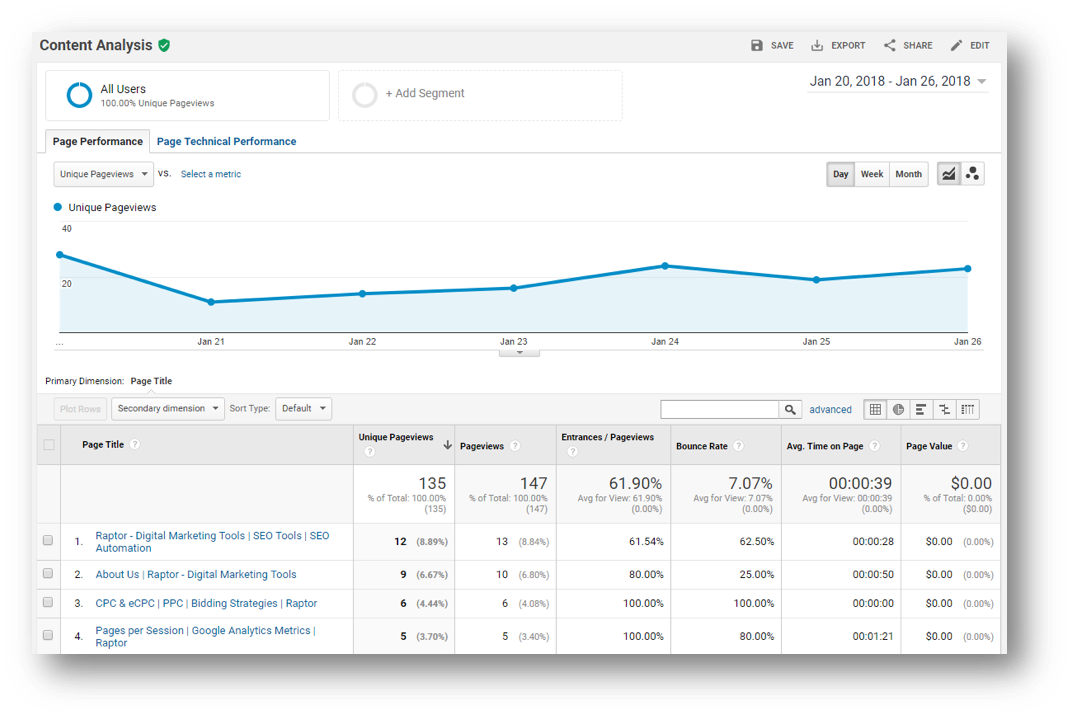
9. Content Performance
In this report we look at the performance on your content delivered from the organic source. This is broken down into two tabs.
Page Performance
The performance tab looks at the top-level performance of your site’s content:
Technical Performance by Page
The technical performance tab shows the page speed components of your content:
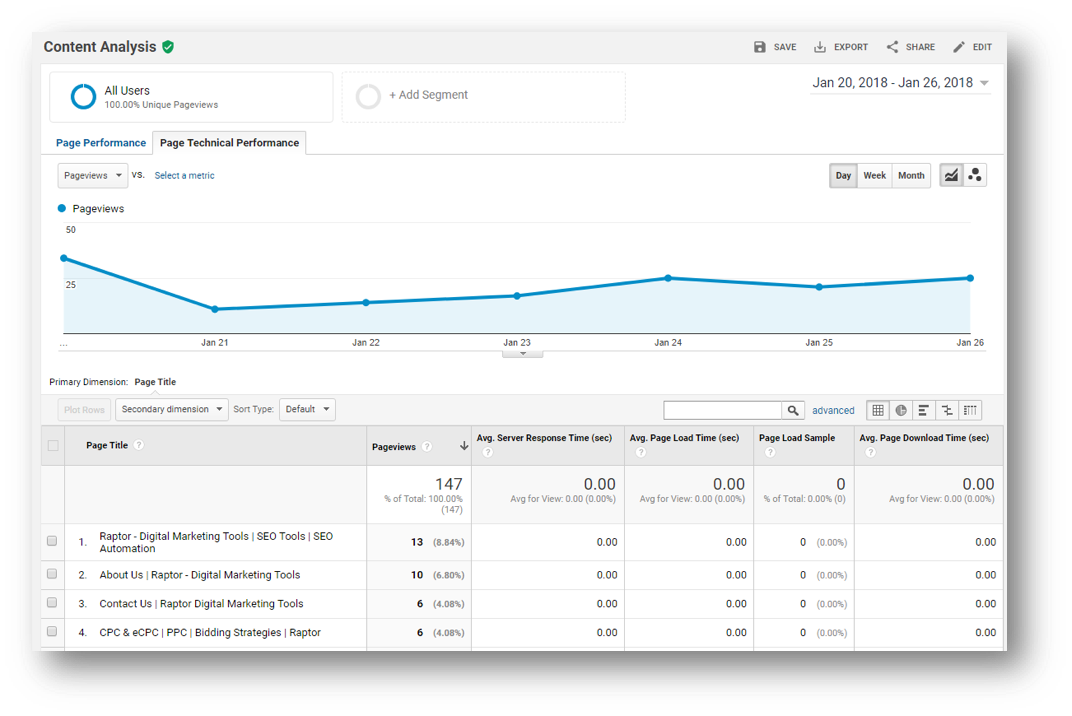
Click the link to get the Google Analytics Custom Report for Content Performance.
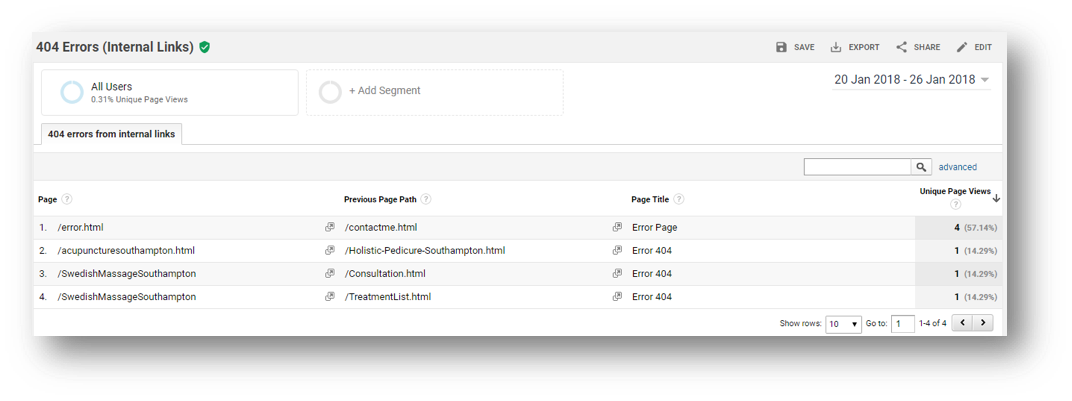
10. 404 Errors from Internal Linking
This nice little report shows you the internal links on your site that are redirecting users to an error page:
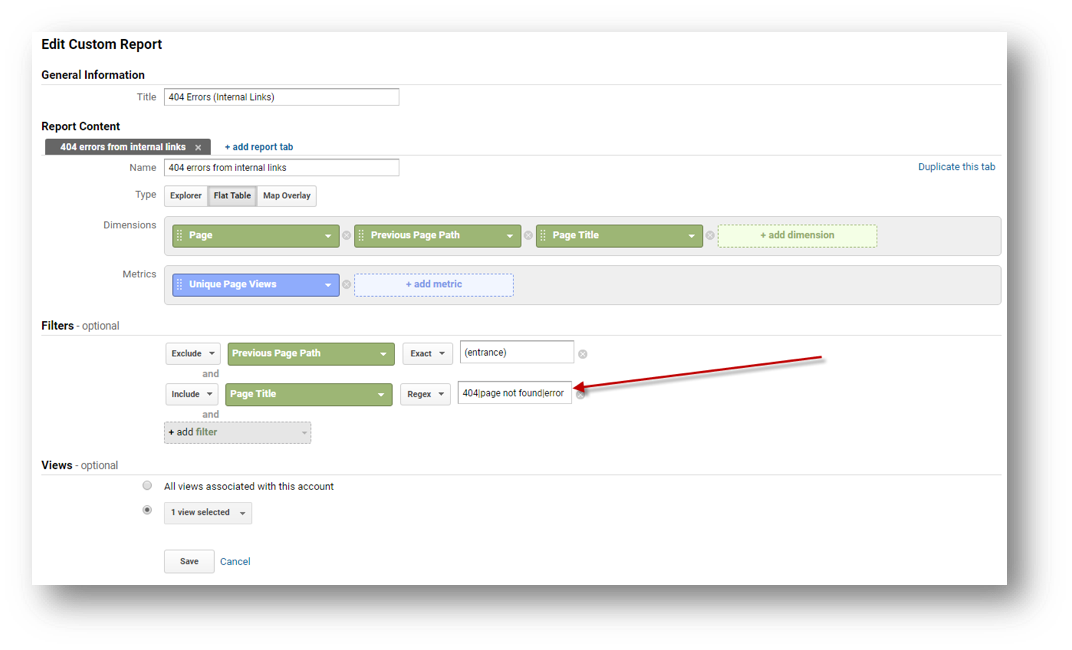
Edit Settings
You will need a custom error page for this report to work and you will need to specify what pages to include from within the field shown in the screenshot below. Just use enough of the filename / URL such that only the custom error page/s are included in this report.
Click the link to get the Google Analytics Custom Report for 404 Errors (Internal Links).
Thanks for reading, this blog post was written by Alec Sharratt from Raptor Digital Marketing Tools.